Note
Go to the end to download the full example code.
Demo Filtered Spectral Initialization
Select Working Directory and Device
import os

from torch.utils import data

os.chdir(os.path.dirname(os.getcwd()))
print("Current Working Directory ", os.getcwd())

import sys

sys.path.append(os.path.join(os.getcwd()))

# General imports
import matplotlib.pyplot as plt
import torch
import os

# Set random seed for reproducibility
torch.manual_seed(0)

manual_device = "cpu"
# Check GPU support
print("GPU support: ", torch.cuda.is_available())

if manual_device:
    device = manual_device
else:
    device = torch.device("cuda:0" if torch.cuda.is_available() else "cpu")
Current Working Directory  /home/runner/work/pycolibri/pycolibri
GPU support:  False
Load dataset
from colibri.data.datasets import CustomDataset
import torchvision
name = "cifar10"
path = "."
batch_size = 1


dataset = CustomDataset(name, path)
  0%|          | 0.00/170M [00:00<?, ?B/s]
  0%|          | 32.8k/170M [00:00<11:04, 257kB/s]
  0%|          | 229k/170M [00:00<02:49, 1.00MB/s]
  1%|          | 885k/170M [00:00<00:54, 3.11MB/s]
  2%|▏         | 3.44M/170M [00:00<00:15, 11.1MB/s]
  4%|▍         | 6.82M/170M [00:00<00:09, 17.6MB/s]
  8%|▊         | 13.4M/170M [00:00<00:05, 29.1MB/s]
 12%|█▏        | 19.7M/170M [00:00<00:04, 35.3MB/s]
 15%|█▌        | 26.1M/170M [00:00<00:03, 39.1MB/s]
 19%|█▉        | 32.4M/170M [00:01<00:03, 41.6MB/s]
 23%|██▎       | 38.8M/170M [00:01<00:03, 43.1MB/s]
 27%|██▋       | 45.5M/170M [00:01<00:02, 44.6MB/s]
 30%|███       | 51.9M/170M [00:01<00:02, 45.3MB/s]
 34%|███▍      | 58.2M/170M [00:01<00:02, 45.7MB/s]
 38%|███▊      | 64.5M/170M [00:01<00:02, 46.0MB/s]
 42%|████▏     | 71.0M/170M [00:01<00:02, 46.4MB/s]
 45%|████▌     | 77.3M/170M [00:02<00:02, 46.4MB/s]
 49%|████▉     | 84.0M/170M [00:02<00:01, 46.9MB/s]
 53%|█████▎    | 90.3M/170M [00:02<00:01, 46.9MB/s]
 57%|█████▋    | 96.7M/170M [00:02<00:01, 46.8MB/s]
 60%|██████    | 103M/170M [00:02<00:01, 46.7MB/s]
 64%|██████▍   | 109M/170M [00:02<00:01, 46.9MB/s]
 68%|██████▊   | 116M/170M [00:02<00:01, 46.7MB/s]
 72%|███████▏  | 122M/170M [00:03<00:01, 46.7MB/s]
 75%|███████▌  | 128M/170M [00:03<00:00, 46.7MB/s]
 79%|███████▉  | 135M/170M [00:03<00:00, 46.8MB/s]
 83%|████████▎ | 141M/170M [00:03<00:00, 46.9MB/s]
 87%|████████▋ | 148M/170M [00:03<00:00, 46.9MB/s]
 90%|█████████ | 154M/170M [00:03<00:00, 46.9MB/s]
 94%|█████████▍| 161M/170M [00:03<00:00, 46.8MB/s]
 98%|█████████▊| 167M/170M [00:03<00:00, 47.0MB/s]
100%|██████████| 170M/170M [00:04<00:00, 41.9MB/s]
Visualize dataset
from torchvision.utils import make_grid

sample = dataset[0]["input"]
sample = sample.mean(0)
sample = sample.unsqueeze(0).to(device)
sample = torchvision.transforms.Resize((128, 128))(sample)
sample = 1*(sample - torch.min(sample)) / (torch.max(sample) - torch.min(sample))
sample = torch.exp(1j * 2*torch.pi * sample)
sample = torch.nn.functional.pad(sample, (32, 32, 32, 32), mode='constant', value=0)
Optics forward model
from colibri.optics import CodedPhaseImaging
from colibri.optics.functional import coded_phase_imaging_forward, coded_phase_imaging_backward


img_size = sample.shape[1:]


wave_length = 670e-9
pixel_size = 1e-6
sensor_distance = 50e-6
approximation = "fresnel"


acquisition_model = CodedPhaseImaging(
    input_shape=img_size,
    pixel_size=pixel_size,
    wavelength=wave_length,
    sensor_distance=sensor_distance,
    approximation=approximation,
    trainable=False,
)


y = acquisition_model(sample, type_calculation="forward", intensity=True)
Estimate phase
from colibri.recovery import LFSI
lfsi_algorithm = LFSI(
max_iters=15,
p=0.9,
k_size=5,
sigma=1.0,
train_filter=False,
dtype=torch.float32,
device=device,
)
x_hat = lfsi_algorithm(y, acquisition_model)
sample = sample.detach().cpu().squeeze().angle()
y = y.detach().cpu().squeeze()
x_hat = x_hat.detach().cpu().squeeze().angle()
normalize = lambda x: (x - torch.min(x)) / (torch.max(x) - torch.min(x))
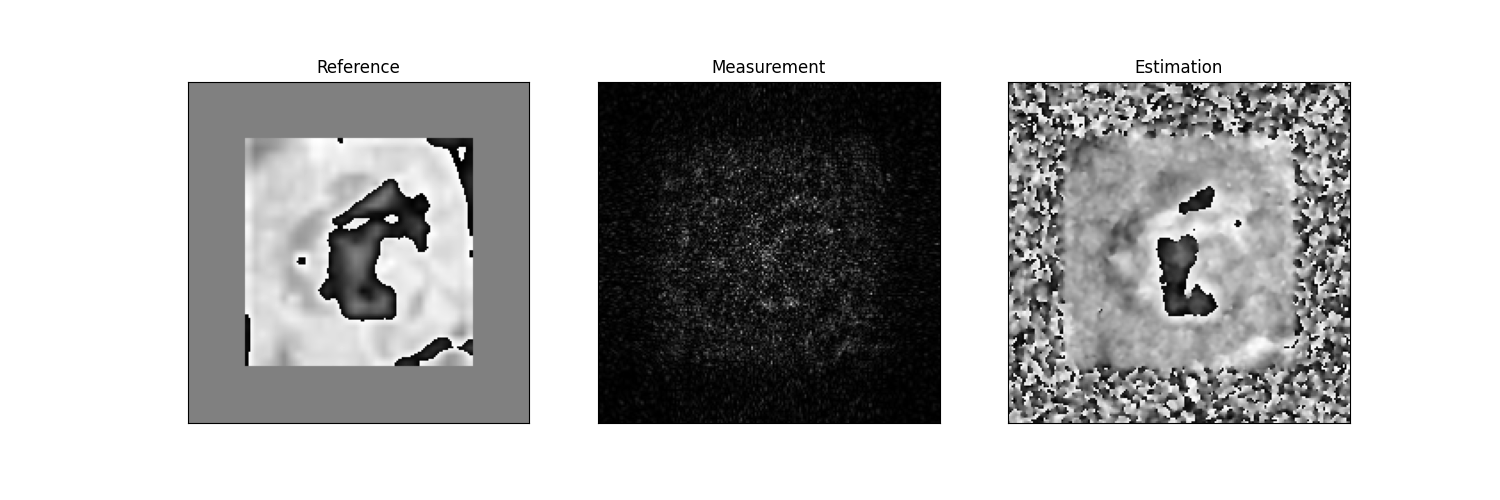
fig, axs = plt.subplots(1, 3, figsize=(15, 5))
axs[0].set_title("Reference")
axs[0].imshow(sample, cmap="gray")
axs[0].set_xticks([])
axs[0].set_yticks([])
axs[1].set_title("Measurement")
axs[1].imshow(y, cmap="gray")
axs[1].set_xticks([])
axs[1].set_yticks([])
axs[2].set_title("Estimation")
axs[2].imshow(x_hat, cmap="gray")
axs[2].set_xticks([])
axs[2].set_yticks([])
plt.show()
Total running time of the script: (0 minutes 7.256 seconds)