Note
Go to the end to download the full example code.
Demo FISTA.
Select Working Directory and Device
import os

from torch.utils import data

os.chdir(os.path.dirname(os.getcwd()))
print("Current Working Directory ", os.getcwd())

import sys

sys.path.append(os.path.join(os.getcwd()))

# General imports
import matplotlib.pyplot as plt
import torch
import os

# Set random seed for reproducibility
torch.manual_seed(0)

manual_device = "cpu"
# Check GPU support
print("GPU support: ", torch.cuda.is_available())

if manual_device:
    device = manual_device
else:
    device = torch.device("cuda:0" if torch.cuda.is_available() else "cpu")
Current Working Directory  /home/runner/work/pycolibri/pycolibri
GPU support:  False
Load dataset
from colibri.data.datasets import CustomDataset

name = "cifar10"
path = "."
batch_size = 1


dataset = CustomDataset(name, path)


acquisition_name = 'spc'  # ['spc', 'cassi']
Visualize dataset
from torchvision.utils import make_grid

sample = dataset[0]["input"]
sample = sample.unsqueeze(0).to(device)
Optics forward model
import math
from colibri.optics import SPC, SD_CASSI, DD_CASSI, C_CASSI
img_size = sample.shape[1:]
acquisition_config = dict(
input_shape=img_size,
)
if acquisition_name == "spc":
n_measurements = 25**2
n_measurements_sqrt = int(math.sqrt(n_measurements))
acquisition_config["n_measurements"] = n_measurements
acquisition_model = {"spc": SPC, "sd_cassi": SD_CASSI, "dd_cassi": DD_CASSI, "c_cassi": C_CASSI}[
acquisition_name
]
acquisition_model = acquisition_model(**acquisition_config)
y = acquisition_model(sample)
# Reconstruct image
from colibri.recovery.fista import Fista
from colibri.recovery.terms.prior import Sparsity
from colibri.recovery.terms.fidelity import L2
from colibri.recovery.terms.transforms import DCT2D
algo_params = {
"max_iters": 2000,
"alpha": 1e-4,
"_lambda": 0.01,
}
fidelity = L2()
prior = Sparsity(basis="dct")
fista = Fista(acquisition_model, fidelity, prior, **algo_params)
x0 = acquisition_model.forward(y, type_calculation="backward")
x_hat = fista(y, x0=x0)
basis = DCT2D()
theta = basis.forward(x_hat).detach()
normalize = lambda x: (x - torch.min(x)) / (torch.max(x) - torch.min(x))
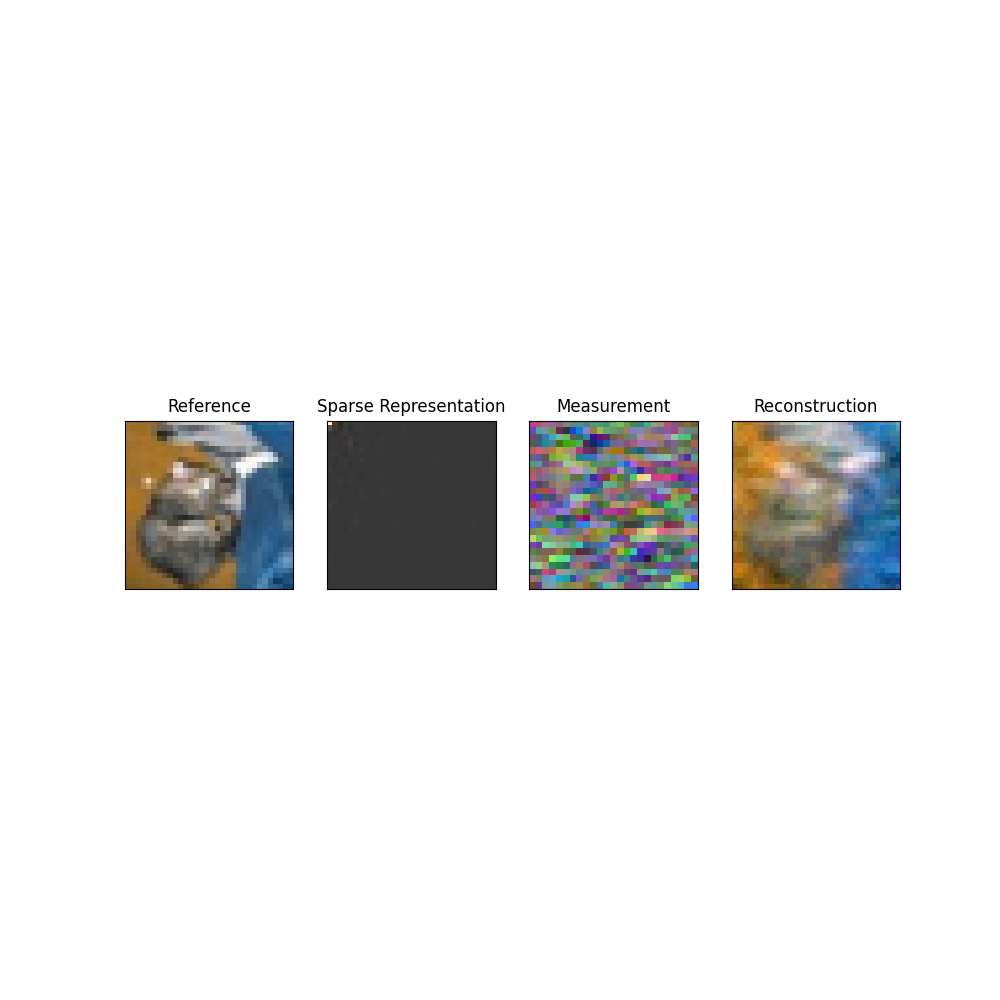
plt.figure(figsize=(10, 10))
plt.subplot(1, 4, 1)
plt.title("Reference")
plt.imshow(sample[0, :, :].permute(1, 2, 0), cmap="gray")
plt.xticks([])
plt.yticks([])
plt.subplot(1, 4, 2)
plt.title("Sparse Representation")
plt.imshow(abs(normalize(theta[0, :, :])).permute(1, 2, 0), cmap="gray")
plt.xticks([])
plt.yticks([])
if acquisition_name == "spc":
y = y.reshape(y.shape[0], -1, n_measurements_sqrt, n_measurements_sqrt)
plt.subplot(1, 4, 3)
plt.title("Measurement")
plt.imshow(normalize(y[0, :, :]).permute(1, 2, 0), cmap="gray")
plt.xticks([])
plt.yticks([])
plt.subplot(1, 4, 4)
plt.title("Reconstruction")
plt.imshow(normalize(x_hat[0, :, :]).permute(1, 2, 0).detach().cpu().numpy(), cmap="gray")
plt.xticks([])
plt.yticks([])
plt.show()
Total running time of the script: (0 minutes 9.853 seconds)